Introduction
There is a significant cost associated with wastewater treatment, which is largely attributable to energy consumption (Logan and Rabaey, 2012). On the other hand, wastewater contains several times more energy than needed for its treatment. Releasing energy stored in the high organic content in domestic, industrial, and agricultural wastewaters represent a potential means to offset this high cost and even for energy production (Perlack et al., 2005). With an ever-increasing demand for wastewater treatment compounded by the enormous cost associated with treatment plant operation, finding more efficient and cost effective means of treating wastewater has become more important than ever. Developing new treatment technologies which will off-set this high-energy cost is necessary to maintain both water and energy security.
Microbial fuel cell (MFC) technology represents one such alternative. Despite its great potential, some researchers lose confidence on the future of MFC for wastewater treatment and energy recovery, primarily due to the great challenge in scaling-up (Logan et al., 2015). For example, compared with our previous reported 0.03L (liquid volume) MFC producing maximum power output of 62.3 mW, the total maximum power of 90L, 100L and 250L MFCs were only slightly higher: 82 mW, 114 mW, and 116 mW, respectively (Feng et al., 2014; Ge et al., 2015; Dong et al., 2015). Although media composition and our experimental conditions contributed the 3-4 orders of magnitude difference in volumetric power density, the main reason should be the difference in reactor architecture.
There are two general strategies for scaling-up MFCs: increasing the size of individual MFCs and connecting multiple MFCs into a stack (Cheng et al., 2014; Aelterman et al., 2006). Unfortunately, increasing individual reactor size typically results in decreased power generation measured in both volumetric power density and surface power density (Janicek et al., 2014; Dekker et al., 2009)i,ii. The decrease in surface power density might be caused by considerable potential loss over large commonly used carbon cloth electrodes, which can be as high as 0.35 V, or about 50% of open circuit potential, for carbon cloth of 1 meter long (Cheng et al., 2014). Another possible cause of the decrease in surface power density is the large internal resistance due to increased anode-cathode spacing, as Ohmic potential loss is proportional to electrode spacing (Fan et al., 2008). In addition to the decrease in surface power density, the decrease in volumetric power density is amplified by the much lower surface/volume ratio of the large individual MFC. Therefore, connecting multiple MFCs into a stack might be the only choice to scale-up MFC while maintaining its performance (Ieropoulos et al., 2008; Wang et al., 2011).
When connected into a stack, MFCs can be connected electrically in series to increase voltage. The open circuit voltage of an individual air cathode MFC is around 0.8V with an operating voltage less than 0.4 V at its maximum power output due to electrochemical losses. Such a low voltage output greatly limits the practical application of MFCs for power generation. Increasing voltage output through series electrical connection has the potential to result in lower power loss compared to other means of boosting voltage due to the lack of conversion energy loss. Serial connection, producing higher voltage but lower current than parallel connection, may also lead to lower power loss in electricity collection and transmission. However, in spite of many attempts, current MFC stack designs have not achieved the ideal voltage output with an overall voltage decrease ranging from 30-98% for serial connection of 2-4 MFCs (Dekker et al., 2009; Gurung et. al., 2012; Oh and Logan 2007; Gurung and Oh 2012). Using power managing system can booster voltage output of parallel connected MFCs, however, the addition of another system can further increase the complexity, thus reduce the reliability of MFC system. Furthermore, the maximum power density or energy output might be affected significantly (Donovan et al., 2011; Adami et al., 2013; Zhu et al., 2011; Wu et al., 2012). A more efficient MFC stack design capable of high power and voltage outputs are critical for successful scaling up of MFC technology.
Among the various MFC designs, the cloth electrode assembly (CEA)-MFC, which contains a compact electrode/separator design resulting in minimized electrode spacing, has demonstrated high performance and treatment efficiency at several milliliter scales (Fan et al., 2012; Janicek et al., 2015a; Fan et al., 2007). This reactor design replaces the membranes with low-cost and low-resistance cloth separators, thus lowering its contribution to the internal resistance of MFCs and greatly increasing the performance of MFCs (Janicek et al., 2015a). The CEA design also has great advantage over other MFC designs in terms of maintaining its performance during scale-up, as the electrode spacing is fixed and thus keeps the specific internal resistance as low as 20 mΩ m2 (Fan et al., 2008). A stable power density of 3.3 Wm-2 was achieved using activated carbon as cathode catalyst during 24 days of operation in batch mode (Janicek et al., 2015b). The high power, relatively low-cost, good scale-up potential, and stability of CEA-MFCs suggest that this configuration may be the best option for MFC stack development.
When MFC are scaled up or connected into stacks, a current collector is typically required to reduce ohmic losses of the electrode (Logan 2010). Although MFCs operate at low current densities, the energy loss can be as much 2 orders of magnitude greater when single point connection is used compared to optimized connections in a larger scale operation (electrode area of 1 m2) (Cheng et al., 2014). Current collectors can either be incorporated as the electrode base material or can be a separate wire or mesh that attaches to the electrode base material (Wei et al., 2011). In MFCs, current collectors have been made from titanium mesh, titanium wire, graphite plates, gold, and stainless-steel mesh (Logan 2010; Wei et al., 2011). Use of stainless steel may not be suitable for MFC applications due to the potential for severe corrosion, which ultimately leads to reduced performance (Janicek et al., 2015a). Precious metal current collectors are also cost prohibitive for scaling up MFC technology. As a result, a more efficient means of current collection is needed while avoiding the use of expensive or unstable current collectors.
In this study, we present a new MFC stack configuration, CEA-MFCs internally connected in serial (iCiSMFC), in which the anode and the adjacent cathode share the same base material, i.e. carbon cloth, avoiding the need of a current collector. An iCiS-MFC equivalent to 3 MFCs was built and operated for approximately one year to demonstrate its long-term stability in producing high voltage output and power density.
Materials and methods
Reactor design and construction
A double iCiS air-cathode CEA-MFCs (3 on each side) was constructed with a total effective surface area of 480 cm2 (for the double CEA-MFC) and a liquid volume of 240 ml (Figure 1a). Each CEA-MFC was placed in between 3 PVC frames. The internal frame, which served as the anode chamber, contained 3 openings measuring 20 cm by 4 cm by 1 cm. Cathodes and anodes were internally connected and made from the same piece of carbon cloth (CCP, fuelcellearth.com) (Figure 1b). The end MFC’s electrodes were connected to the external circuit via a titanium wire, forming a double iCiSMFC stack with 3 MFC connected in series on the top (designated as Stack A) and 3 on the bottom (designated as Stack B) (Figure 1a). A non-woven fabric layer was sandwiched between the anode and cathode of each CEA-MFC as previously described (Fan et al., 2012). In order to prevent gas from becoming trapped between the anode and cathode, 1 cm x 1 cm slits, as previously described, were cut into the anode to provide a means for gas to be released (Fan et al., 2012). Carbon cloth cathodes were constructed as previously described with an activated carbon loading of 25 mg cm-2 (Janicek et al., 2015b). Each MFC was labeled according to the position in Stack A (MFC1, MFC2, MFC3) and Stack B (MFC1, MFC2, MFC3) according to Figure 1a.
Figure 1. (a) Schematic of iCiS-MFC stacks containing 3 CEA-MFCs connected internally in series on the bottom initially (Stack A) and 3 on the top initially (Stack B). Also shown are the internal and external electrical connections, direction of hydraulic flow, and position/naming of individual MFCs within the reactor; (b) Schematic showing the anode/cathode pairs, each made from a single piece of carbon cloth (resulting in the internal electrical connection); and (c) photograph of the reactor.

MFC operation and analysis
The MFC was inoculated with a mixed bacterial culture as previously described (Fan et al., 2012). Acetate (5.9 g/L or 0.59 g/L) was used as the substrate and the medium solution contained the following (per liter), unless otherwise specified: NH4Cl, 1.5 g; KCl, 0.13 g; NaH2PO4.H2O, 4.67 g; Na2HPO4.7H2O, 12.4 g; and mineral (12.5 ml) and vitamin (12.5 ml) solutions as reported (Lovley and Phillips 1988). The MFC experiments were operated at 32 ± 1°C in a temperature controlled chamber. The reactor was operated hydraulically in series. The reactor was initially operated in batch mode to facilitate startup of the reactor. The system was switched to the continuous flow mode after three days as the power output started to increase significantly. Then the reactor was continuously fed at a flow rate of 3 ml min-1 maintained through a peristaltic pump, corresponding to a hydraulic retention time of 80 min (unless otherwise specified). The external resistance of both the top and bottom reactors was set to maintain an operating voltage ∼ 0.9 V during normal operation. The reactor was operated for a total of 365 days. For the first 100 days the reactor was operated at 5.9 g L-1 (100 mM) acetate and 80 mM PBS at different HRTs to determine the optimal operating conditions at higher substrate concentration. For the next 115 days, the reactor was operated at different substrate concentrations and different HRTs to further examine the effect of operational conditions on MFC performance. For the remaining 150 days, the reactor was operated at 0.59 gL-1 (10 mM) acetate and 10 mM PBS at an HRT of 25 minutes to determine performance and stability at lower substrate and buffer concentration. Total stack voltage as well as the voltage of individual MFCs were monitored using a multichannel data acquisition system (2700, Keithly, USA).
Results and discussion
Start-up of the iCiS-MFC
During start-up, the resistance of the Stack A and Stack B were controlled separately and set at 1000 ohms to facilitate growth of the biofilm. The voltage of Stack A (bottom) rapidly reached a maximum of 1.72 V within 3 days of operation (Figure 2a). During this period, voltage of individual MFCs of Stack A were similar, ranging from maximum values between 0.56 V to 0.6 V during the first 3 days, with a variability of less than 7% between MFCs (Figure 2b). The resistance of Stack A, controlled using a variable resistor, was then set to maintain an operating voltage of ∼ 1.5 V for another five days to further facilitate anodic biofilm development. In the following 18 days of operation, the resistance was incrementally decreased to achieve a higher power output and stabilized at operating voltage of ∼ 0.9 V corresponding to approximately 0.3 V per MFC in the series.
Figure 2. Voltage and power as a function of time during start-up of (a) Stack A; (b) individual cells of Stack A (bottom).
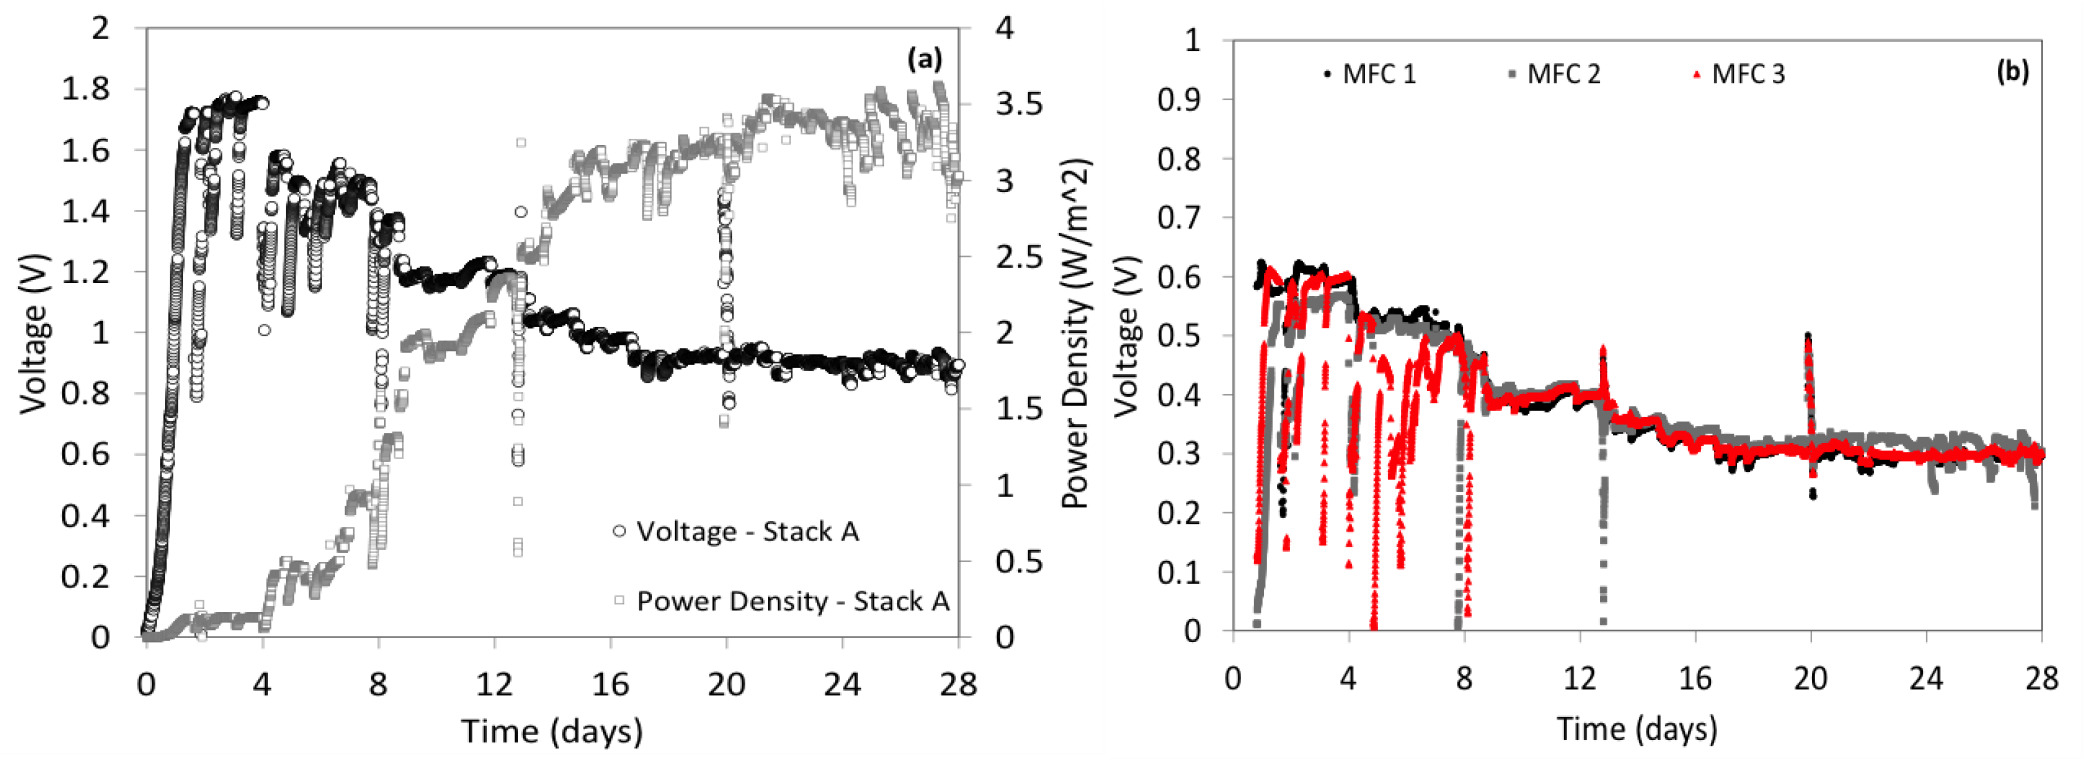
Stable power output for Stack A reached a maximum of 3.5 Wm-2 after 18 days of operation (Figure 2a), which was 6% higher than that previously obtained (3.3 W m-2) in a significantly smaller CEA-MFC operated in batch mode (Zhu et al., 2011). This result indicates that power can be maintained during scale-up with a greater than 33-fold increase in total cathode surface area and greater than 20-fold increase in reactor volume. It should be noted that the result for the smaller scale CEA-MFC was obtained at a buffer concentration of 50 mM, which was lower than that used to obtain the result presented here (80 mM). However, previous results have shown that when buffer concentration was increased from 50 mM PBS to 100 mM PBS, in a similar smaller CEA-MFC operated under similar conditions, power density only increased 11% (Fan et al., 2012). The result presented here is also similar to that obtained when platinum was used as the cathode catalyst in a smaller CEA-MFC operated under similar conditions (Fan et al., 2012). The equivalent specific internal resistance, computed from polarization curve, is 23.8 mΩ m2 for Stack A (Figure S1), which is comparable to that achieved in a similar smaller reactor (Fan et al., 2012).
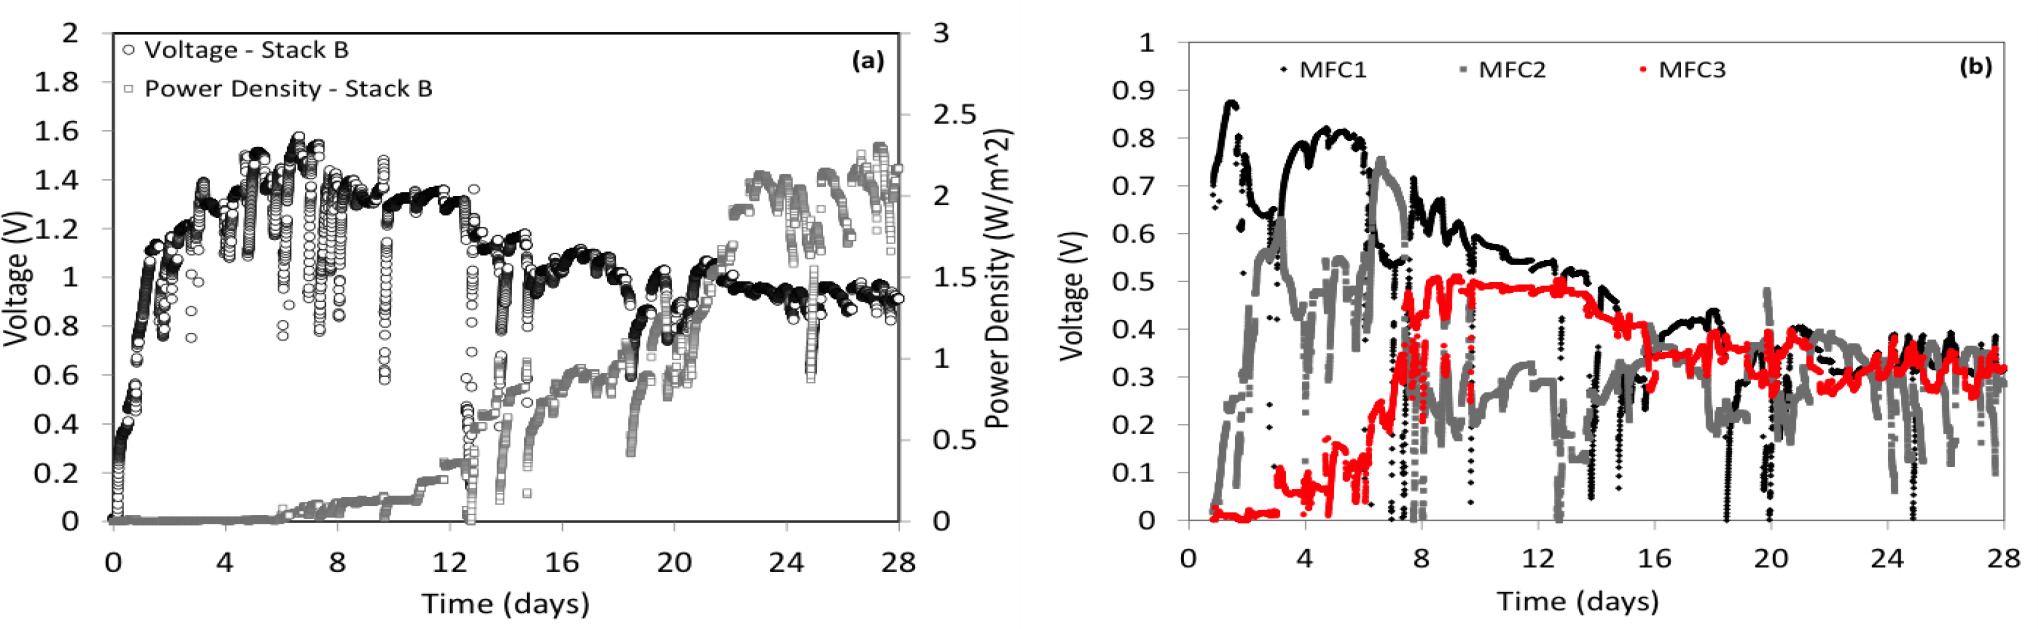
The voltage of Stack B (top) reached a maximum value of ∼ 1.57 V at 1000 ohms resistance after 7 days of operation, which was 9% lower and took twice as long as Stack A (Figure 3a). The resistance of Stack B was then adjusted to maintain an operating voltage of ∼ 1.4 V for 5 days. During this start-up period voltage of individual MFCs of Stack B were highly variable, ranging from 0.07 V to 0.77 V (Figure 3b). After this 12 day’s operation, the resistance was gradually decreased until a total stack operating voltage of ∼ 0.9V was achieved in approximately 20 days. However, voltage of individual MFCs remained significantly variable with 36% variability between cells. Furthermore, voltage of individual MFCs also varied between 0.25V and 0.36V. By comparison, Stack B took slightly longer to achieve a stable power output, reaching 2.2 Wm-2 after 20 days of operation, representing a power density 37% lower than Stack A (Figure 3a).
Figure 3. Voltage and power as a function of time during start-up of (a) Stack B; (b) individual cells of Stack B (top).
Effect of the stack location on performance
Due to the higher performance and faster start-up of Stack A, and the highly variable voltage of Stack B during and after start-up, it was believed that reactor location may have led to the significantly different performance of the stacks. Therefore, after 28 days of operation, the reactor was flipped so that Stack A was operating as the top reactor and Stack B was operating as the bottom reactor. Voltage of individual MFCs of Stack A (initially the bottom reactor) were similar prior to flipping the reactor (Figure 4a). However, variability in voltage between individual MFCs began to increase after the reactor was flipped, ranging from 0.23 V to 0.32 V, representing a 32% difference between individual MFCs (Figure 4a). In contrast, voltage of individual MFCs of Stack B (initially the top reactor), prior to flipping, were highly variable (Figure 4b). Once the reactors were flipped, variability in voltage decreased to only 7% between individual MFCs, ranging from 0.29 V to 0.31 V (Figure 4b). Furthermore, the decreased voltage variability corresponded to an increase in power density of Stack B (Figure 4c), which ultimately reached a maximum value of 3 Wm-2 after 40 days of operation (Figure S2). This represents a greater than 36% increase in power density when Stack B was operated as the bottom reactor compared to when operated as the top reactor, although it was 14% less than the maximum power achieved with Stack A before flipping. Flipping the reactors, however, had a detrimental effect on Stack A, as power density was decreased 28% to 2.5 Wm-2.
Figure 4. Performance of the reactor before and after flipping showing (a) voltage as a function of time for Stack A; (b) voltage as a function of time for Stack B; and (c) power as a function of time for both Stack A and Stack B.

The higher performance and stable voltage of Stack B when operated as the bottom reactor in combination with the decreased performance and variable voltage of Stack A after the reactors were flipped indicate that reactor location can significantly affect performance. The reduced performance when reactors are operated as the top reactor is likely due to mass transfer limitations and increased electrode spacing caused by gas being trapped within the CEA structure. Despite gas-venting slits in the anodes, when operated as the top reactor, gas is more likely to become trapped, as it will rise unless otherwise prevented. Both increased electrode spacing and mass transfer limitations; caused by gas build-up, result in increased internal resistance, which ultimately decreases performance. Distribution of trapped gas within the CEA structures would not be the same across the 3 MFCs connected in series. Gas could accumulate in one MFC faster and/or in larger quantities than in other MFCs in the series.
As a result, internal resistance of individual MFCs will be different within the Stack, ultimately leading to the highly variable voltage observed when either Stack A or Stack B was operated as the top reactor. Differences in internal resistance could also affect biofilm growth, limiting development during the critical start-up phase, ultimately effecting maximum power density achievable within a stack of MFCs.
Effects of operational conditions (HRT, substrate and buffer concentrations) on iCiS-MFC performance
At an acetate concentration of 5.9 g/L, decreasing HRT from 240 min to 120 min resulted in an increase in power density of Stack B by 6% from 2.56 to 2.71 Wm-2 (Figure 5a). Further decreasing HRT from 120 min to 80 min resulted in a further increase in power density by 11% (3 Wm-2). However, decreasing HRT from 80 to 60 min did not result in further increase in power density. A similar trend was observed for Stack A.
Figure 5. Power density as a function of HRT for (a) Stack A & B operated at higher acetate concentration (5.9 g L-1); and (b) Stack A & B operated at lower acetate concentration (0.59 g L-1).
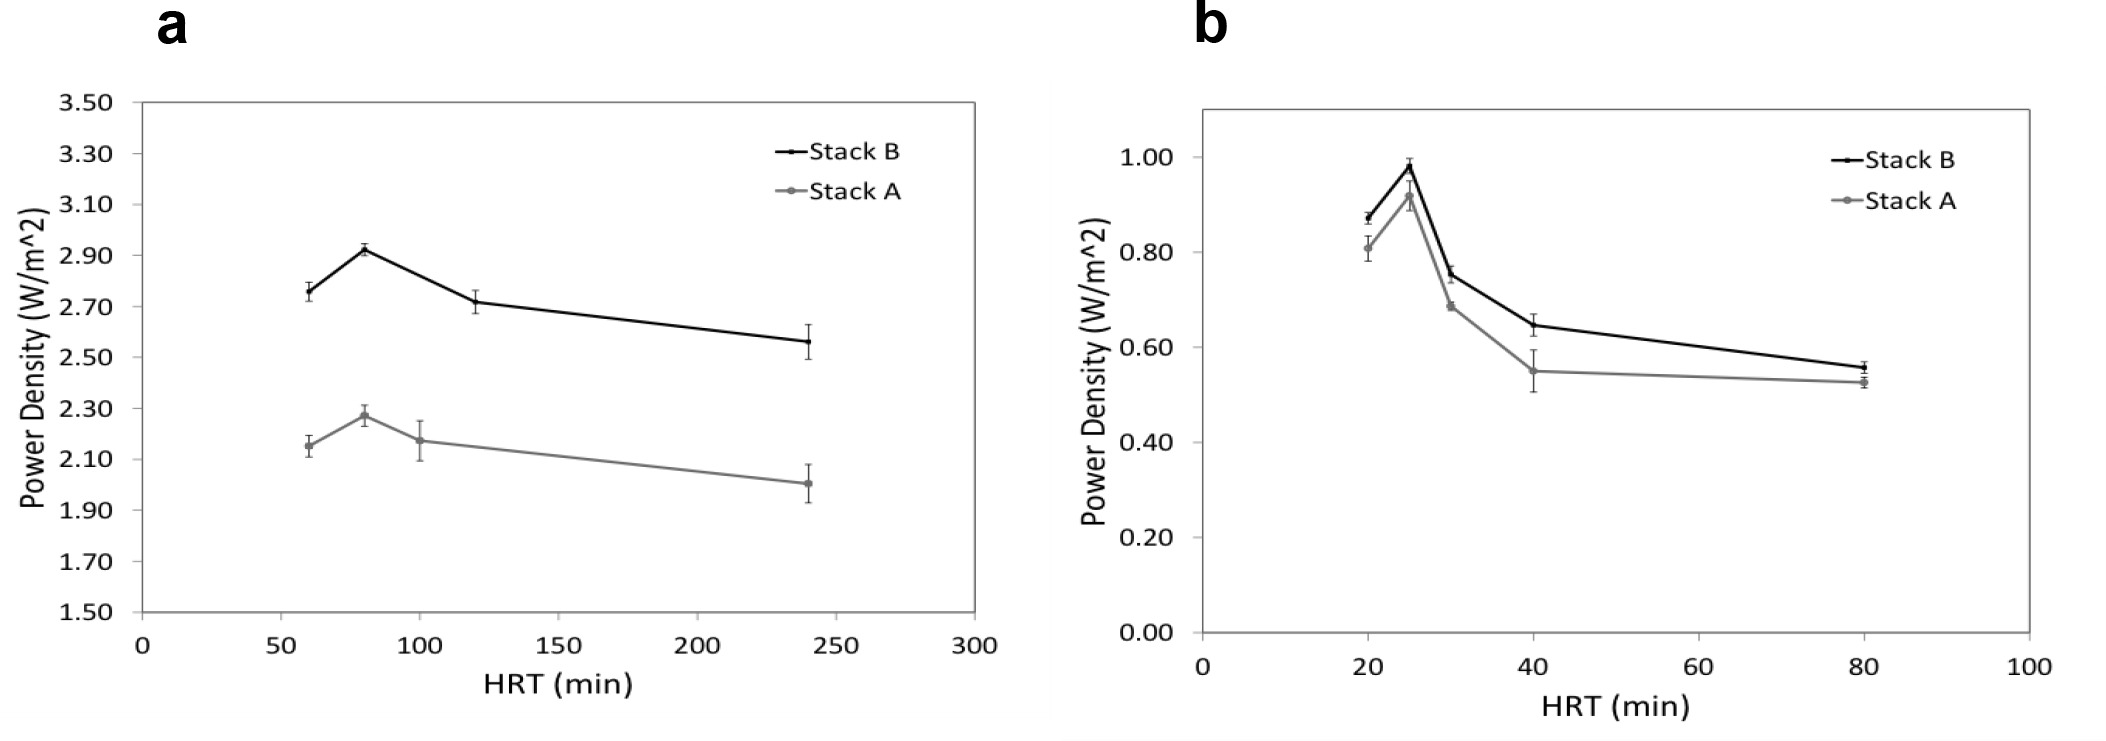
When the MFC stacks were operated at lower acetate concentration (0.59 g L-1), power density decreased by more than 68% for both Stack A and Stack B. Decreasing HRT of Stack B from 80 min to 40 min resulted in an increase in power density by 21% from 0.55 Wm-2 to 0.67 Wm-2 (Figure 5b). An additional decrease in HRT from 40 min to 25 min resulted in an additional increase in power density by 46% (0.98 Wm-2). However, further decreasing HRT from 25 to 20 min resulted in a decrease in power density by 12%. A similar trend was observed for Stack A.
The results at both high and low acetate concentration, presented here, indicate that at longer HRTs, substrate can become limiting when iCiS-MFC s are operated hydraulically in series (Janicek et al., 2014) i. The decreased performance at the lowest HRTs tested (highest flow rates) was possibly due to lower concentration of produced bicarbonate buffer (Fan et al., 2012) Hata! Yer işareti tanımlanmamış.. Furthermore, significantly higher performance was achieved when the reactor was operated at the higher acetate concentration. This has not been shown to be the case for other MFC designs in which increasing acetate concentration beyond 0.59 g L-1 did not appreciably affect performance (Cheng and Logan 2011). The disparity might be due to the high substrate utilization rate achieved in the CEA-MFCs caused by the much higher electrode area/volume ratio and development of a highly efficient anodic biofilm resulting from the lowered internal resistance of the iCiS-MFCs.
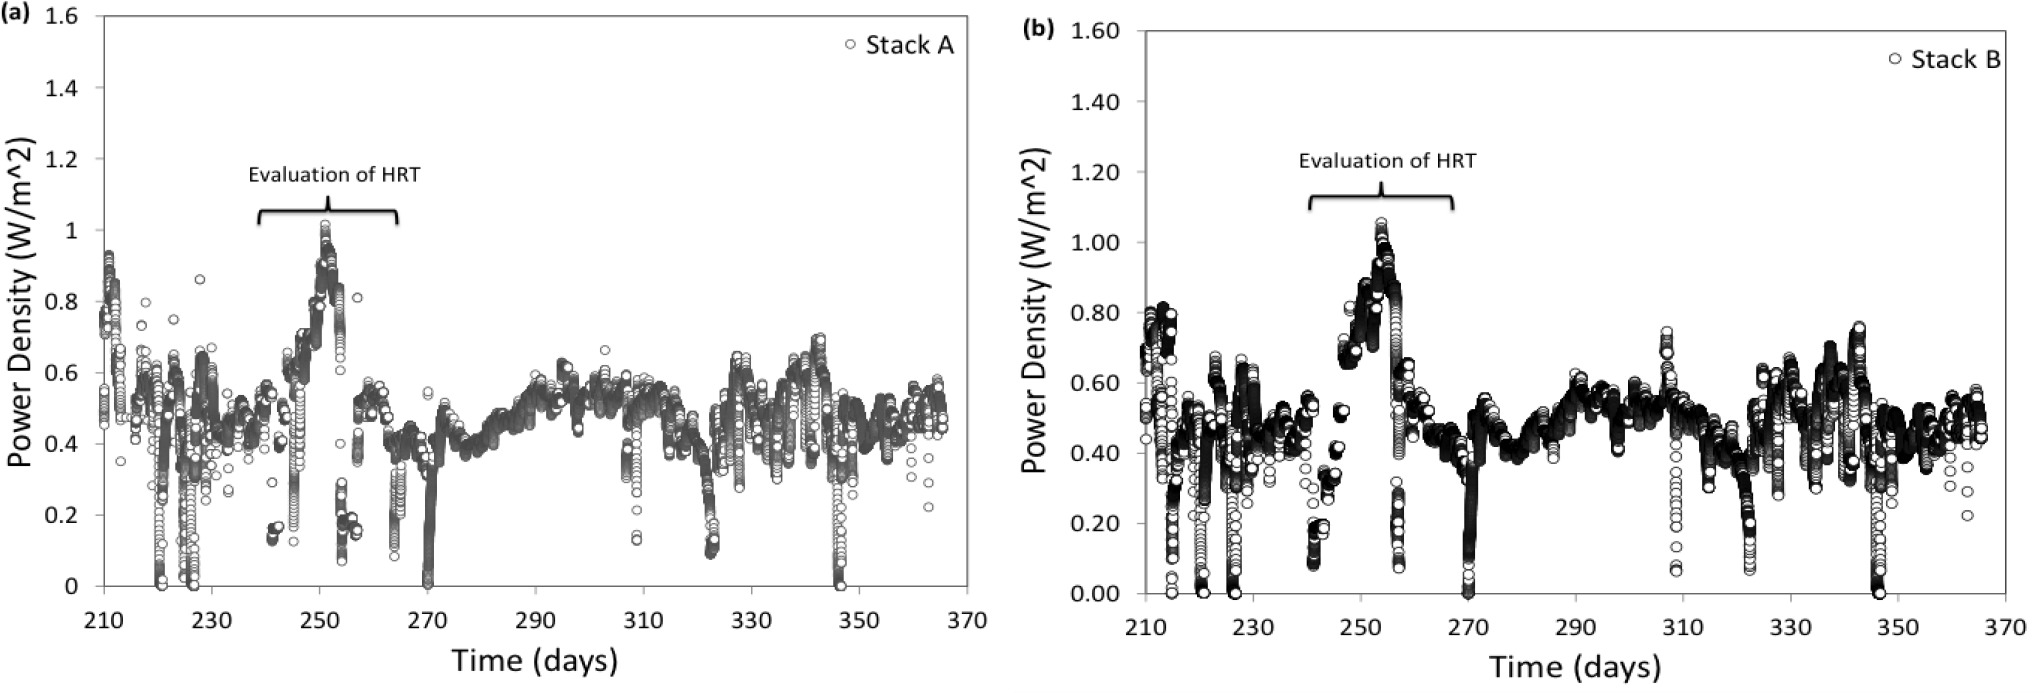
It is well known that increasing buffer concentration can increase maximum power generation of MFCs (Liu et al., 2005). However, addition of large quantities of buffers will likely be cost prohibitive for practical applications. To investigate how power generation of the newly developed system was affected by the buffer concentration, iCis-MFC stack were also operated under low buffer concentration (10 mM PBS). Results show that power reached a maximum of 1.5 Wm-2 at an acetate concentration of 5.9 g L-1 (Figure 6). This represents only 50% decrease in power density when buffer concentration is decreased from 80 mM PBS to 10 mM, suggesting the produced bicarbonate might considerably contribute to the reduction in internal resistance. When the substrate concentration decreased to 0.59 g L-1, the power density further decreased to 0.5 Wm-2 and remained stable over the 150 days of operation. (Figure 7a and b, Figure S2). The significant decrease in power density at lower acetate concentration might be due to substrate limitation and less produced bicarbonate buffers.
Figure 6. Power density as a function of substrate (acetate) concentration for Stack B operated at 10 mM PBS.
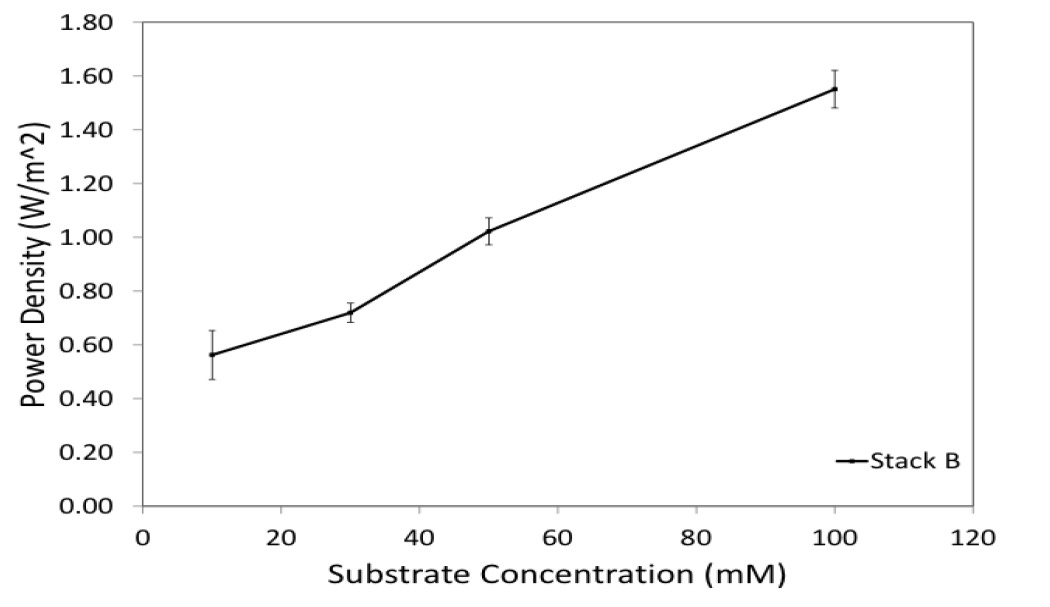
Figure 7. Power density as a function of at an acetate concentration of 0.59 g L-1 and buffer concentration of 10 mM PBS for (a) Stack A; and (b) Stack B.
Conclusions
Results presented here demonstrate that the iCiS-MFCs can achieve a high stable power output of over 3 W/m2 at an overall voltage output of 0.9 V. The high performance can be attributed to both the CEA structure and the design of internal series connection, which lead to lower internal resistance. The lowered internal resistance combined with the fact that the reactor was acclimated at the higher acetate concentration (5.9 gL-1), may also have allowed a highly efficient anodic biofilm to develop. The internal series connection also alleviated the need for a current collector, resulting in reduced cost for fabrication and enhanced reliability. With this design, reactor size was increased significantly with no decrease in performance, as is typically the case when increasing MFC reactor size. Voltage reversal, a common issue for serially connected MFCs, hasn’t affected the operation of the iCiS-MFC during the one-year operation. These results clearly demonstrate the great potential of this iCiS-MFC s design for scaling-up.
Lower performance when both stacks were operated as the top reactor suggests that trapped gas may be an issue during scale-up if the current operational mode is used. One alternative is to operate the reactor in a vertical orientation rather than the current horizontal orientation. Vertical orientation in combination with gas release mechanisms may prevent gas from becoming trapped between electrodes. The activated carbon/carbon cloth cathode used in this study is well suited for this type of operation, as it has shown high pressure tolerance (Janicek et al., 2015a; Janicek et al., 2015b). Results presented here also indicate that a high degree of voltage variability between MFCs in a stack, during start-up, may lead to lower performance during the stable power output phase. Facilitating even biofilm growth during start-up phase seems crucial.
The high and low acetate concentrations tested in the reactor represent COD values of approximately 6000 mg L-1 COD and 600 mg L-1 COD, respectively, as representatives of typical food pressing wastewater and municipal wastewater. The significantly higher power density of the reactor at the higher acetate concentration suggests that treating wastewaters with higher COD values would be more appropriate for the iCiS-MFC to balance the energy recovery and capital cost. Treating municipal wastewater may not justify the current expense of MFC technology, as adequate energy may not be generated to offset the high cost of MFCs. In addition, despite the low internal resistance caused by the internal series connection compared to reactors connected in series that don’t contain this feature, low buffer concentration presents a significant challenge to performance, especially when substrate concentration is also low. Further scaling up this reactor could be accomplished by increasing the number of MFCs connected in series as well as increasing the size of each MFC. Further investigation into scaling-up the iCiS-MFC design will ultimately determine any limitations with respect to size and reactor effectiveness for practical application.