Introduction
Microbial fuel cells (MFCs), which use microorganisms to convert chemical energy stored in biodegradable substances to electricity represent an emerging clean energy production technology (Rittman et al., 2008). The working principle of an MFC is based on biocatalytic oxidation of the carbon source at the anode and a reduction reaction of an electron acceptor at the cathode; where oxygen, potassium ferricyanide/permanganate/dichromate and ferric chloride have been used as electron acceptors so far (Oh et al., 2004; You et al., 2006; Wei et al., 2012; Kumar et al., 2017; Ucar et al., 2017). Among them, the use of oxygen has been the most common in recent years due to its sustainability and renewability compared to the others, while single chamber designs with air-cathodes further simplified MFC operation by allowing passive oxygen transfer and eliminating the need for aeration of aqueous cathodes used in double chamber systems (Liu and Logan, 2004). When oxygen is employed as a cathodic electron acceptor, low kinetic rate of oxygen reduction reaction (ORR) occurring at the surface of carbon or graphite electrodes necessitates the use of an electrocatalyst to lower the activation energy barrier and increase the current output of MFCs (Rismani-Yazdi et al., 2008). Platinum (Pt), which is a widely used cathode catalyst in the form of nanoparticles dispersed on a carbon support (Pt/C) for MFC studies, is considered to have the highest catalytic activity towards ORR among metals based on the calculations of O2- , O- and OH- binding energies (Lima et al., 2007; Wang et al., 2014;). However, as an expensive noble metal, the use of Pt in cathodes has been reported to account for approximately 50% of the total cost of lab-scale MFCs, making this electrocatalyst economically non-viable, especially for targeted large-scale wastewater treatment applications (Rozendal et al., 2008). Although some efforts have been made to completely replace Pt catalyst with metal oxides (Xia et al., 2018; Majidi et al., 2019; Ayyaru et al., 2019), metal-nitrogen-carbon complexes (Lu et al., 2016; Yang and Logan, 2016; Tang and Ng, 2017), and metal-free carbon materials (Feng et al., 2011; Liu et al., 2015); reported maximum power densities were either lower than achieved with Pt/C cathode at the same catalyst loading (Feng et al., 2011; Majidi et al., 2019; Ayyaru et al., 2019) or higher than obtained with Pt/C cathode but required higher loadings of alternative catalysts than typical benchmarking loading of Pt (0.5 mg cm-2) (Liu et al., 2015; Xia et al., 2018). Therefore, if the criterion of catalyst loading is considered along with maximum power density, Pt can be still regarded as the best performing catalyst material in the majority of the studies and reducing its use to lower loadings on cathodes without significant loss in performance might be another suitable approach to decrease MFC costs.
Previously, the effect of reduced Pt loadings on performance has been examined by several studies in MFC literature in different aspects. Cheng et al. performed chronopotentiometry to air-cathodes with Pt loadings ranging from 0.1 to 2 mg cm-2 and reported a potential difference less than 10-20 mV for all samples with respect to 0.5 mg Pt cm-2 cathode when Nafion was used as the binder material. They also found a 19% decrease in maximum power density of MFC when Pt loading was reduced from 0.5 to 0.1 mg cm-2 (Cheng et al., 2006). In the work of Mateo et al., maximum current density and power density from polarization data were strongly dependent on Pt loading of cathodes ranging from 0.25 to 2 mg cm-2, however open circuit voltages (OCVs) and treatment capacity of MFCs with a synthetic wastewater did not differ significantly (Mateo et al., 2017). Santoro et al. tested the time-dependence of power densities obtained throughout an operational period of 8 days in MFCs with a wider range of Pt loadings on cathodes (0.005-1 mg cm-2) and they showed that difference between power densities achieved with high (1 and 0.5 mg cm-2) and lower Pt loadings became smaller over this period (Santoro et al., 2013). Although these studies provide useful information about losses in some performance indicators related to MFC operation for their own experimental conditions; they lack a quantitative analysis of electrochemical processes occurring at the cathode which limit the power outputs of MFCs when catalyst loadings are reduced. In this context, determining individual sources of internal resistance of cathodes can help to better understand the effect of cathode structure with reduced Pt loadings on overall MFC performance and to design more effective electrodes with such low catalyst loadings accordingly. Electrochemical impedance spectroscopy (EIS), which is a powerful electrochemical technique for characterization of fuel cells/electrodes, can be used to determine ohmic, charge transfer and diffusion resistance constituting three main components of internal resistance; for which contribution of these processes to voltage losses are not distinguishable in the more commonly used polarization curve method (Yuan et al., 2007). In spite of higher charge transfer resistances expected for cathodes with reduced Pt loadings, the extent of these increases in charge transfer resistance and the effect of catalyst loading on the other resistances related to ohmic and diffusion processes, if exists, remain unknown.
In this study, air-cathodes with Pt loadings ranging from 0.01 to 0.5 mg cm-2 were prepared by a conventional ink-based method. Performance of single chamber MFCs with different cathodes was investigated in terms of polarization behaviour, maximum power density and Coulombic efficiency. To give insight into changes in the internal resistance compositions of cathodes when Pt loading was reduced, EIS was performed on polarized cathodes.
Materials and methods
Electrodes
Anodes and cathodes of MFCs were non-wet proofed and wet proofed carbon clothes (BASF Fuel Cell Inc.), respectively. Anodes were used as purchased without any treatment whereas the air side of the cathodes were coated to have one carbon base layer and four additional PTFE diffusion layers, as described previously (Cheng et al., 2006). To produce the catalyst layer on the solution-facing side of the carbon cloth cathodes, a catalyst ink with a density of 87.5 mg Pt/C mL-1 was prepared by thoroughly mixing Pt/C catalyst (20 wt.% Platinum on Vulcan XC-72R, BASF), Nafion ionomer solution (5 wt.%, Sigma-Aldrich), isopropyl alcohol and water. To achieve 0.5 mg Pt cm-2 loading on the cathode, corresponding volume of the starting ink was directly pipetted onto carbon cloth for brush coating. For lower loadings, corresponding volumes of the starting ink were pipetted into separate tubes and further diluted with isopropyl alcohol and water to make the resulting inks applicable to the carbon cloth substrate for brush coating. The weight ratio of the ionomer (dry) to Pt/C catalyst was 3:7 in all cathodes and the volume ratio of the solvents (water and isopropyl alcohol) was 1:1 in all the inks prepared. The amount of Pt on cathodes was verified by weighting the cathodes before the coating and after the end of the drying process at room temperature (24 hours). Tested Pt loadings were 0.5 mg Pt cm-2, 0.1 mg Pt cm-2, 0.05 mg Pt cm-2, 0.03 mg Pt cm-2 and 0.01 mg Pt cm-2. A cathode with a carbon base layer and diffusion layers on the air side but without catalyst loading on the solution side was also prepared as a negative control sample.
Construction, acclimation and operation of MFCs
Six membrane-less air-cathode MFCs were constructed from 12 mL plexiglass cube-shaped reactors in which anodes and cathodes were placed in opposite sides of the reactor chamber. The surface area of both anodes and cathodes was 7 cm2. MFCs were operated in batch mode and with an external resistance of 1 kΩ except during polarization measurements. Before testing cathodes with different platinum loadings in MFCs, anodes were colonized with activated sludge as starting inoculum and sodium acetate medium solution which contained 1 g sodium acetate, 0.31 g NH4Cl, 0.13 g KCl, 4.54 g NaH2PO4.H2O, 2.44 g Na2HPO4, 12.5 mL mineral and 12.5 mL vitamin solution per liter (Lovley and Phillips, 1988). Colonization of anodes was started by adding inoculum and sodium acetate medium to the reactors in a 1:1 volume ratio until voltage outputs exceeded 100 mV and continued by adding only medium solution afterwards. During this acclimation period, all six cathodes were identical carbon cloths with 0.5 mg Pt cm-2 catalyst loading to ensure uniform conditions in all reactors. Anodes were considered acclimated when reproducible voltage outputs were obtained from at least 3 batch cycles. At this point, cathodes were changed with newly fabricated cathodes with different Pt loadings.
Analysis
Voltage generation of the MFCs was monitored at 10 min intervals using a digital multimeter with a data acquisition system (Pico Technology). Current (I= V/R) and power (P= I.V) were calculated based on Ohm’s law and normalized to the cathode projected surface area. Polarization data were obtained by multiple cycle method (Watson and Logan, 2011), in which the resistors of MFC circuits were changed from 1 kΩ to 100 Ω and each resistor was used during complete batch cycles (triplicate). 3-hour of maximum steady-state period of voltage vs. time graphs was used to average voltage, current and power values. Columbic efficiency (CE) was calculated as the ratio of actual Coulombs obtained to the theoretical amount of Coulombs that can be obtained from the substrate during a batch cycle, by integrating current over time and using the formula
where F is Faraday’s constant (F=96 485 C mol-1), b is the number of moles of electrons produced per mole of acetate (b= 8), S is substrate concentration (S=1 g L-1), v is the liquid volume (v=0.012 L) and M is the molecular weight of sodium acetate (M= 82 g mol-1) (Liu et al., 2005).
Electrochemical impedance spectroscopy
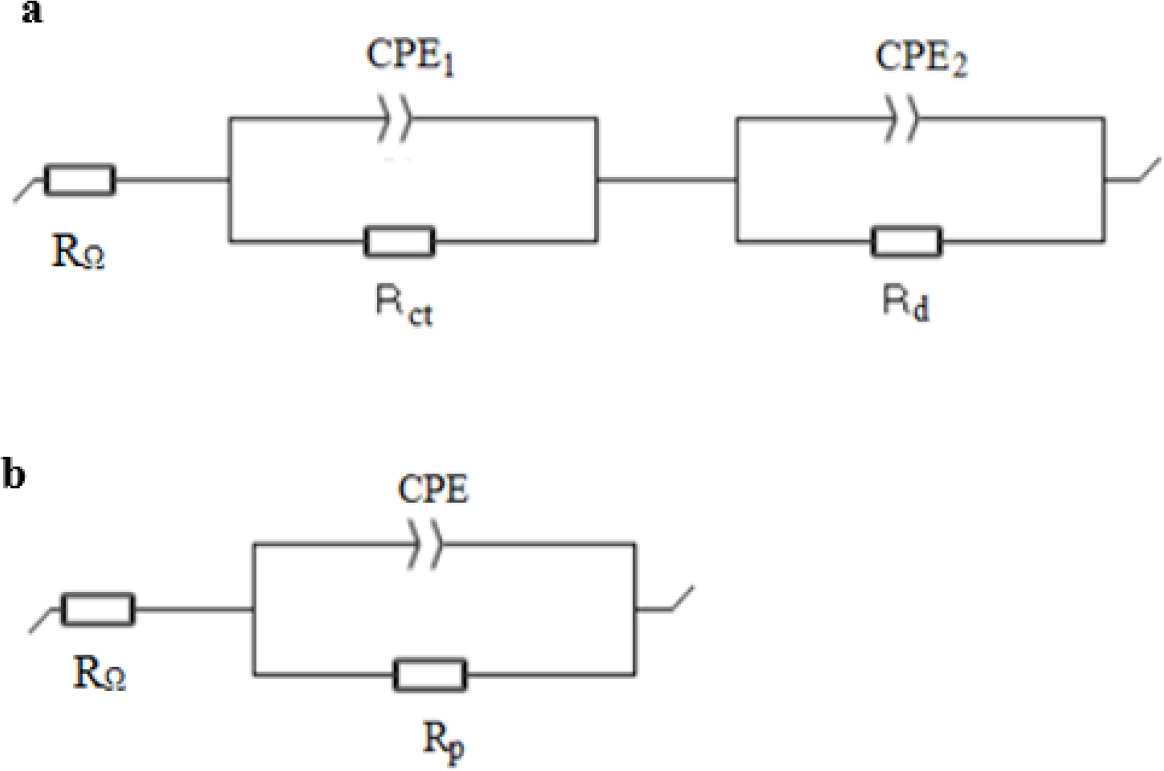
Electrochemical impedance spectroscopy (EIS) was performed on cathodes by using a 3-electrode setup which consisted of cathode as the working electrode, anode as the counter electrode and an Ag/AgCl reference electrode (+197 mV vs. SHE). Measurements were conducted in potentiostatic mode over a frequency range of 100 kHz to 5 mHz with an AC signal of 10 mV amplitude and data registration of 10 points per decade by using a potentiostat (Bio-Logic Science Instruments). Before the impedance measurements, the working electrode was stabilized at open circuit potential (OCP) and then the potential to be applied for EIS was set for 30 minutes. Cathode potentials were set to -0.2 V vs. Ag/AgCl with an aim to observe the effects of both kinetic and diffusion processes in the spectra; for which the applied potential was assumed to provide suitable polarized conditions for cathodes based on measured cathode OCP values. Additional measurements were taken at less polarized conditions on some samples to evaluate the potential dependence of the impedance behaviour. EIS data were analysed with EC-Lab software by fitting the spectra with equivalent circuits shown according to the flooded-agglomerate model of gas diffusion electrodes (Zhang et al., 2011; Springer and Raistrick, 1989). In both circuits, constant phase elements (CPEs) were used to represent non-ideal behaviour of capacitors due to non-homogeneous surface roughness, coating and reaction rate distribution on electrodes (He and Mansfeld, 2009). Impedance of a CPE is mathematically expressed as follows:
where j is the imaginary unit (j2 = -1), Q is pseudo-capacitance (Ω-1 s a or F s a-1), f is frequency (Hz) and a is CPE exponent (Dominguez-Benetton et al., 2012). For the cathodes whose Nyquist impedance plots showed 2 clear loops, the equivalent circuit with two time constants in Figure 1a was used to determine the values of electrochemical components; namely RΩ for ohmic resistance, Rct for charge transfer resistance in parallel with CPE1 for the kinetic process and Rd for diffusion resistance in parallel with CPE2 for a diffusional process. For the cathodes which showed a single apparent loop in Nyquist plots, the equivalent circuit with one time constant in Figure 1b which consisted of serial connection of RΩ with a parallel combination of polarization resistance Rp and CPE was used; where Rp was suggested as the sum of charge transfer and diffusion resistance (Rp= Rct+Rd). To avoid complications of high frequency artefacts resulting from experimental setup, typically observed for all samples in this study, data fitting was performed between 1.5 kHz and 5 mHz. Values of χ2/|Z| were reported to represent the goodness of the fit of the equivalent circuits with data.
Figure 1. Equivalent circuits used to fit impedance data which shows a) two loops b) one loop in Nyquist plots.
Results and discussion
Voltage generation
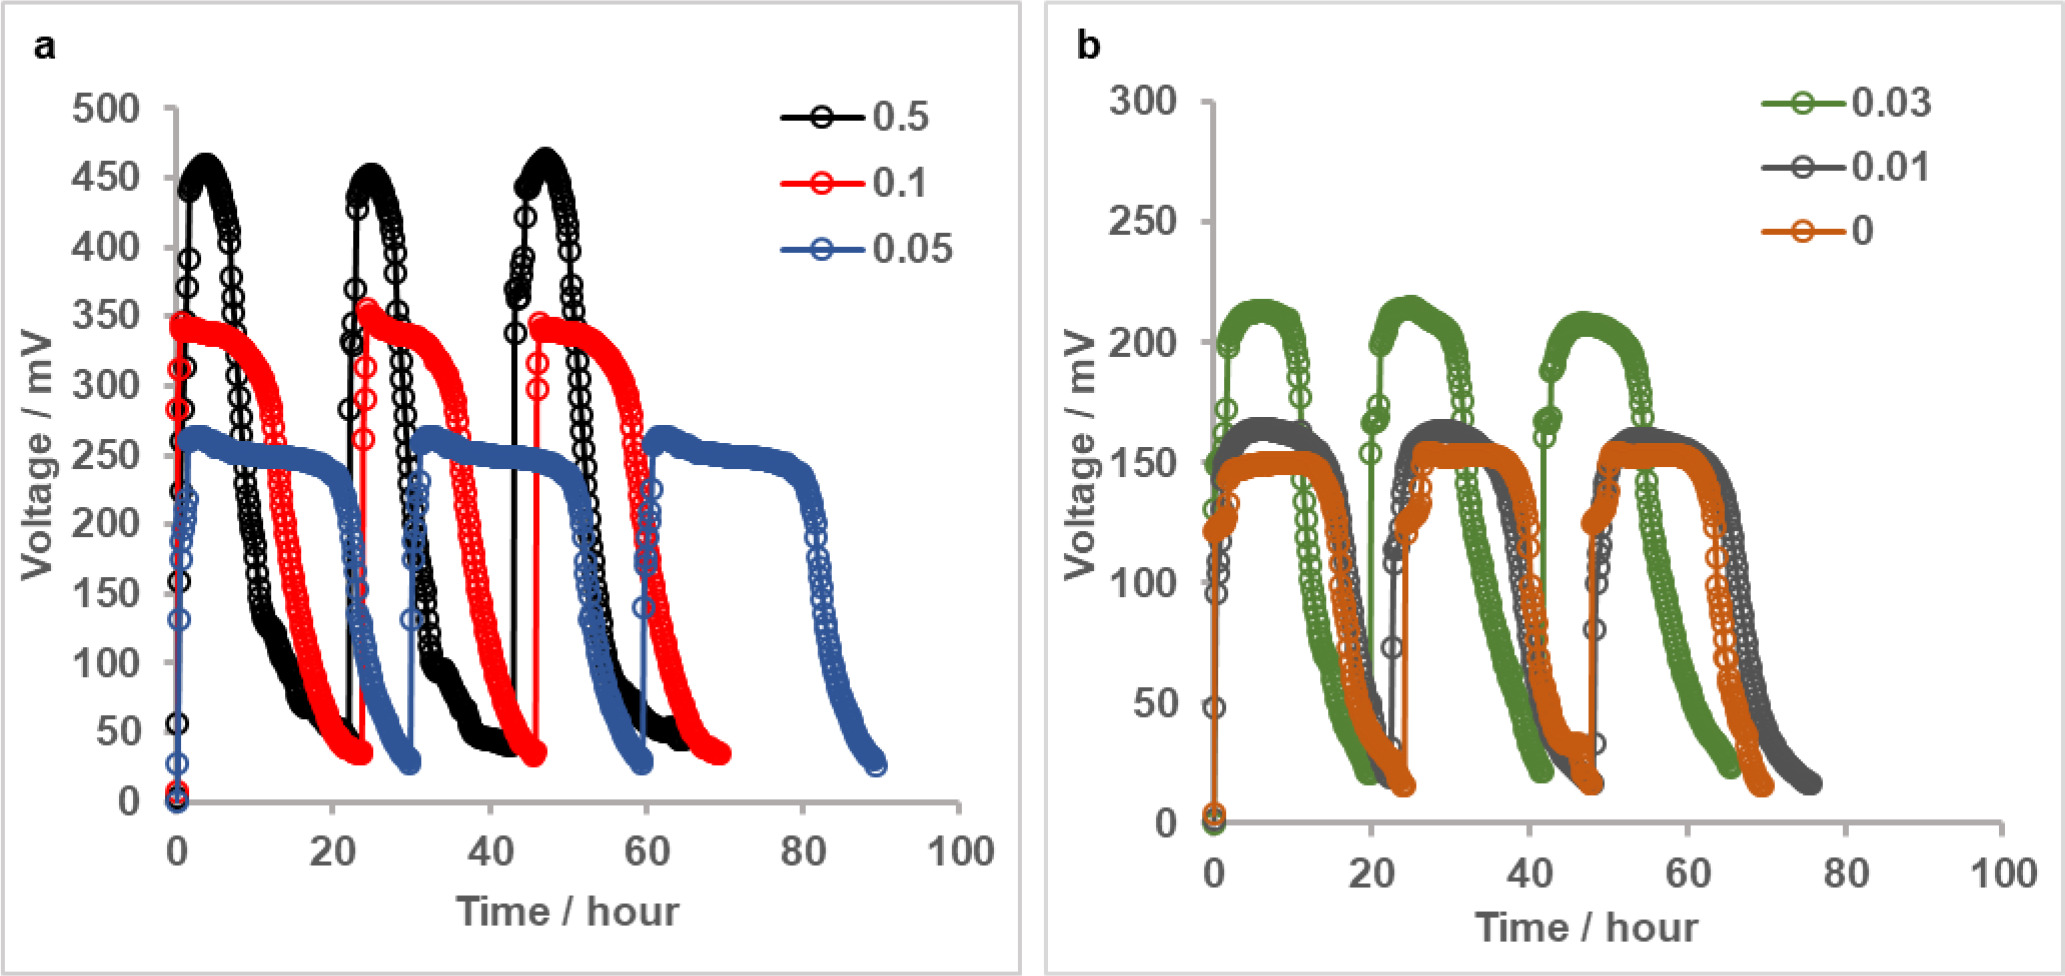
After acclimating bacteria in MFCs and ensuring similar performances for anodes based on comparable voltage outputs with the same type of cathodes in all reactors; cathodes were replaced with newly fabricated ones having different Pt loadings and stable voltage generation with new electrodes was confirmed. Figure 2a and 2b show 3 successive cycles of voltage production in MFCs at 1 kΩ, indicating reproducible power generation of MFCs with each cathode. The maximum voltage of 456 ± 5 mV produced by MFC with cathode of highest Pt loading in this study (0.5 mg Pt cm-2) decreased to 343 ± 4 mV, 263 ± 3 mV and 211 mV ± 3 when loading was reduced to 0.1, 0.05 and 0.03 mg Pt cm-2, respectively. The maximum voltage obtained with a minimal catalyst loading on cathode (0.01 mg Pt cm-2, 162 ± 2mV) was only slightly higher than that obtained with bare cathode (154 ± 1 mV). Durations of voltage cycles ranged from ∼22 hours to 30 hours and they did not show a clear relationship with cathode catalyst loading.
Figure 2. Reproducible voltage generation of MFCs with a) 0.5, 0.1 and 0.05 mg Pt cm-2 cathodes b) 0.03, 0.01 and 0 mg Pt cm-2 cathodes at 1 kΩ.
Voltage losses and power densities of MFCs
The performance of the MFCs having different catalyst loadings on cathodes were evaluated in terms of their polarization behaviour and generated power densities. At open circuit conditions, cell voltage decreased with decreasing Pt loadings on cathodes and were in 736-762 mV range for the MFCs with 0.03 to 0.5 mg Pt cm-2 cathodes and much lower for the MFCs with 0.01 mg Pt cm-2 and bare cathodes (611 and 602 mV, respectively). Measurement of the open circuit potentials (OCPs) of the cathodes individually with a reference electrode showed that OCP of the 0.5 mg Pt cm-2 cathode slightly decreased from 560 mV to 541-531 mV vs. SHE with decreasing loadings down to 0.03 mg Pt cm-2; and then to ∼ 397 and 387 mV vs. SHE for the 0.01 mg Pt cm-2 and zero loadings. This indicated that OCPs of the anodes were close in all MFCs and differences in the cell voltage at zero current were due to different cathode OCPs.
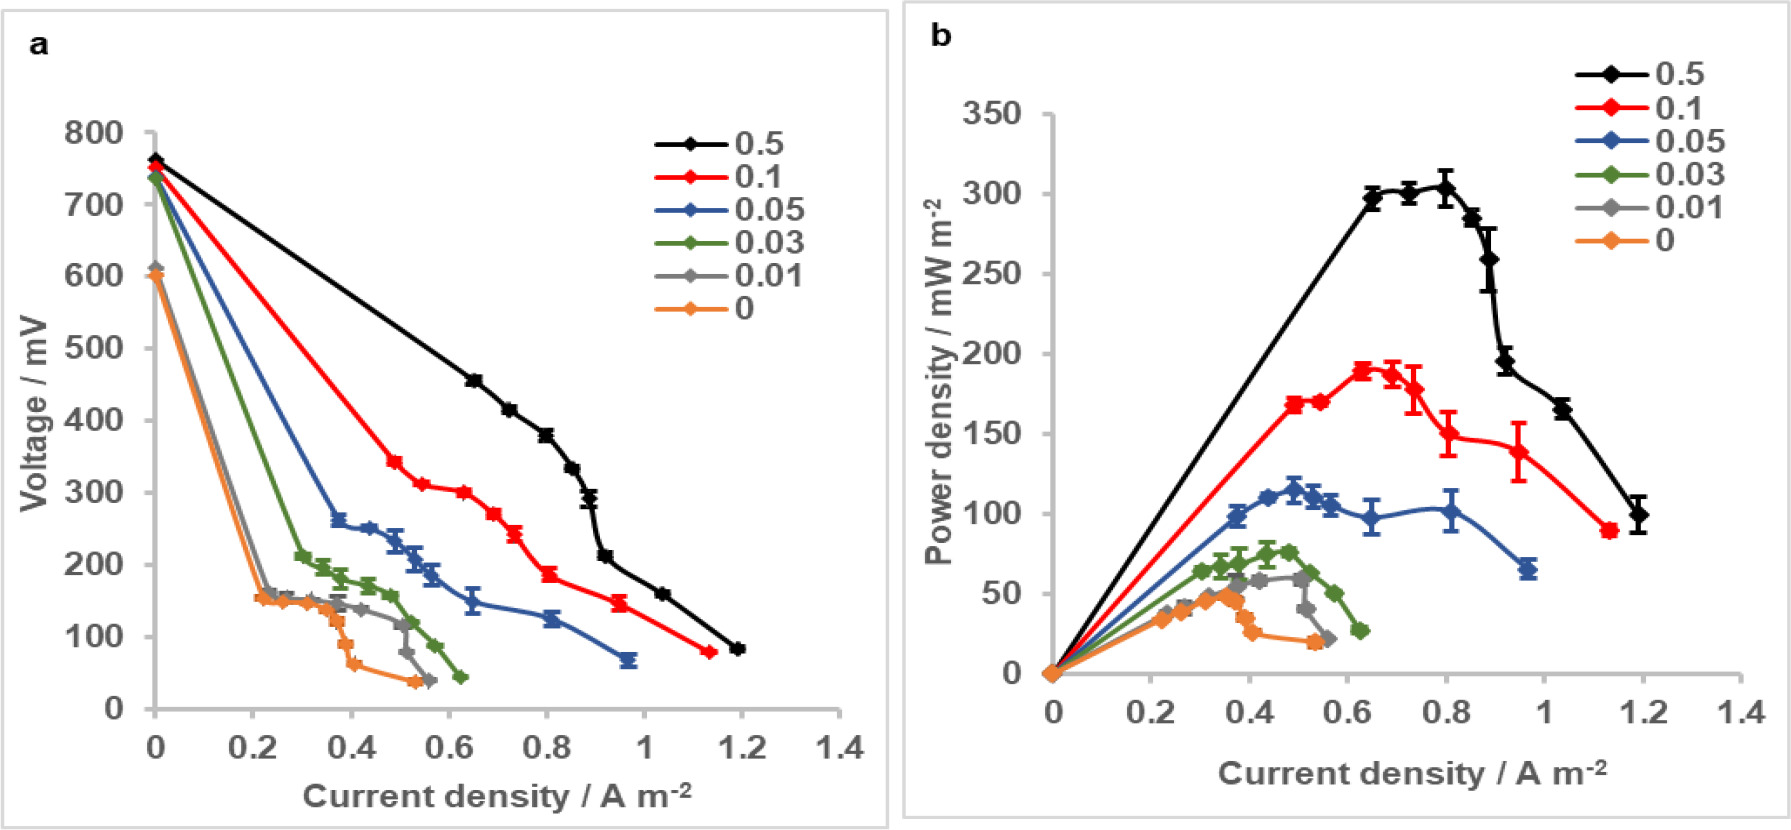
The polarization curves of MFCs showed that overpotentials of the cells with bare and 0.01 mg Pt cm-2 loaded cathodes were comparable up to a current density of ∼ 0.35 A m-2 and at ∼ 0.55 A m-2, whereas they differed in the 0.35-0.55 A m-2 range (Figure 3a). For MFCs having higher catalyst loading on cathodes (0.03, 0.05, 0.1 and 0.5 mg Pt cm-2), overpotential was increased with decreasing catalyst loadings in the entire range of current densities. The maximum power density obtained in MFC with the cathode of the highest Pt loading in this study (0.5 mg Pt cm-2) was 303 ± 11 mW m-2 (Figure 3b). When the catalyst loading of cathode was reduced to 0.1 mg Pt cm-2, MFC generated a power density of 189 ± 5 mW m-2, showing a 38% decrease compared to that generated with 0.5 mg Pt cm-2 cathode. Further reducing Pt loading on cathodes decreased maximum power density by 62% for 0.05 mg cm-2 (115 ± 8 mW m-2), 75% for 0.03 mg cm-2 (76 ± 7 mW m-2) and 80% for 0.01 mg cm-2 (59 ± 3 mW m-2) cathodes. The maximum power density of MFC obtained without catalyst on cathode (48 ± 1 mW m-2) was approximately one sixth of that obtained with the highest Pt loading on cathode and slightly lower than that of MFC with 0.01 mg Pt cm-2 cathode. These results suggested that reducing the catalyst loading of 0.5 mg Pt cm-2 by a factor of 5 or more significantly affected MFC performance in terms of voltage losses and maximum power density; and even with the closest Pt loading of 0.1 mg cm-2 to this benchmarking cathode, difference in overvoltages and maximum power densities was notable.
Figure 3. a) Polarization and b) power density curves of MFCs with cathodes having different Pt loadings. Error bars represent standard deviations based on triplicate measurements.
Coulombic efficiencies of MFCs
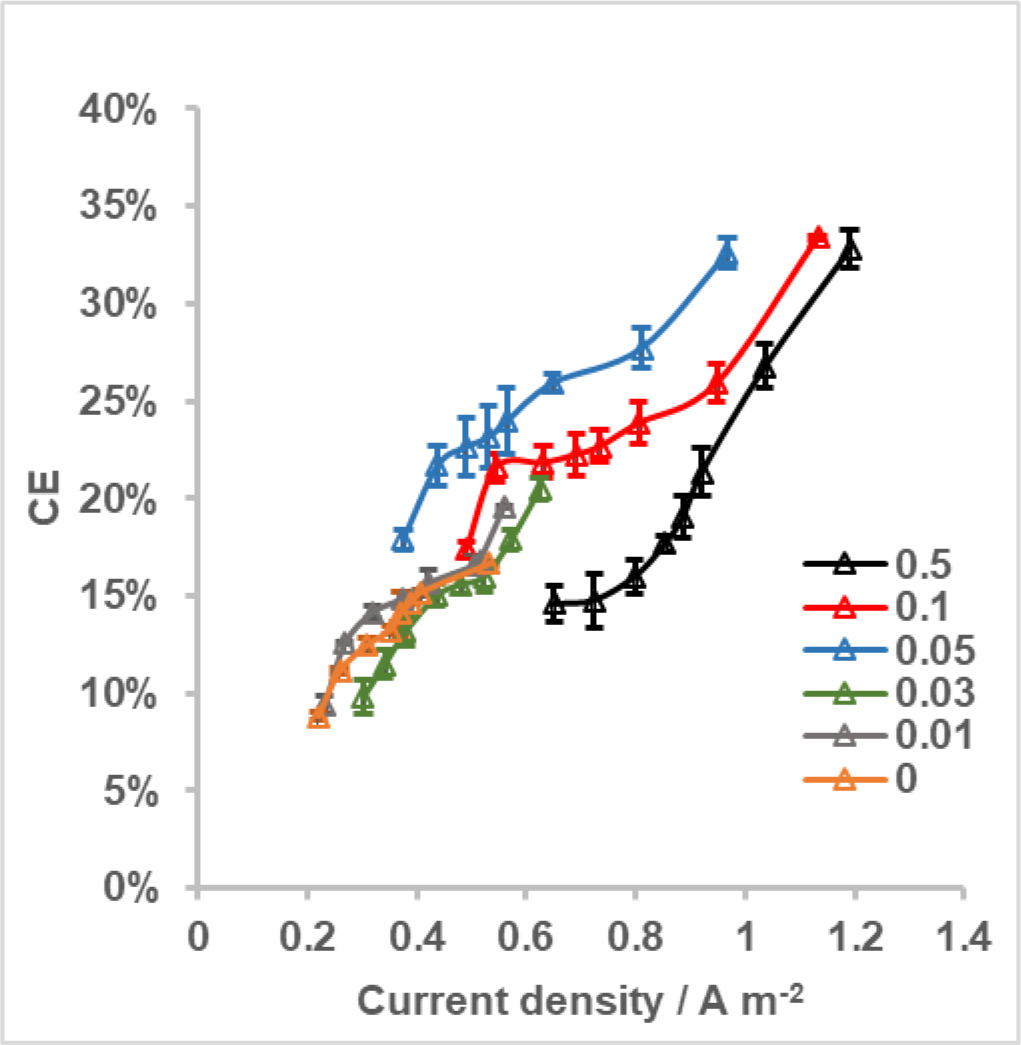
Coulombic efficiencies (CEs) of MFCs with different cathodes were calculated for the entire current density range measured in polarization tests to evaluate the effect of Pt loading on this performance indicator. For each MFC, CE was increased with increasing current density (Figure 4). CE range of MFC with 0.5 mg Pt cm-2 cathode was between ∼15% and 33% whereas it was slightly different for MFCs with 0.1 mg Pt cm-2 and 0.05 mg Pt cm-2 cathodes (17-33% and 18-32%, respectively). However, at a given current density; CE of MFC with 0.05 mg Pt cm-2 cathode was higher than other two, possibly resulted from longer batch cycle durations for this MFC compared to the others. When the Pt loading on cathodes was further reduced; CEs for MFCs varied from 10% to 20% for 0.03 mg Pt cm-2, from 9% to %20 for 0.01 mg Pt cm-2 and from 9% to 17% for bare cathodes. These CEs were comparable on the basis of both quantity and corresponding current density, unlike MFCs of cathodes with higher Pt loadings.
Figure 4. CE as a function of current density for MFCs with cathodes having different Pt loadings. Error bars represent standard deviations based on triplicate measurements.
Impedance of the cathodes with different Pt loadings
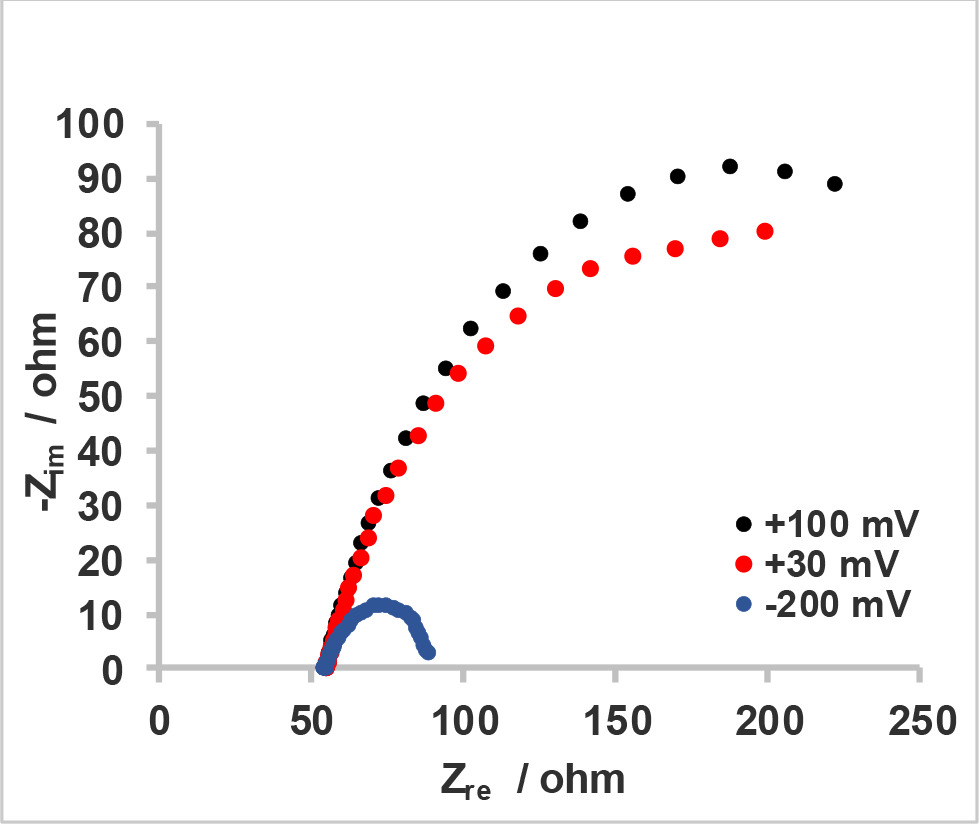
EIS was performed on cathodes with different Pt loadings at polarized conditions. At a cathode potential of -0.2 V vs. Ag/AgCl, Nyquist impedance plots showed that the total internal resistance of cathodes decreased with increasing Pt loadings; inferred from decreasing resistances in the low frequency region of the spectra (Figure 5a and 5b). Complex plane impedance plots of cathodes with 0, 0.01 and 0.03 mg Pt cm-2 consisted of two well separated semi circles, which could be attributed to charge transfer and diffusion processes (Figure 5a); whereas plots of cathodes with higher loadings (0.05, 0,1 ,0.5 mg cm-2) showed a single loop in which charge transfer and diffusion regions were indistinguishable at first glance. In additional experiments with higher applied potentials to these cathodes (0.1 mg Pt cm-2 cathode is given as an example in Figure 6), it was observed that arcs in the impedance spectra converged to larger semi-circles with increasing potentials; indicating that it is both possible for these samples to be found in kinetic-controlled or kinetic/diffusion mixed controlled region when the set potential was -0.2 V. We therefore referred to the semi-circles of the spectra in Figure 5b to as polarization resistance (Rp), in which contributions of charge or mass transfer remained unknown until a second mathematical analysis of the data. A more detailed analysis of impedance spectra for the cathodes with these 3 highest loadings is discussed below.
Figure 5. Nyquist plots of cathodes with a) 0, 0.01, and 0.03 mg Pt cm-2 loadings b) 0.05, 0.1 and 0.5 mg Pt cm-2 loadings. Symbols and lines represent experimental data and data obtained by fitting the spectra with equivalent circuits, respectively.
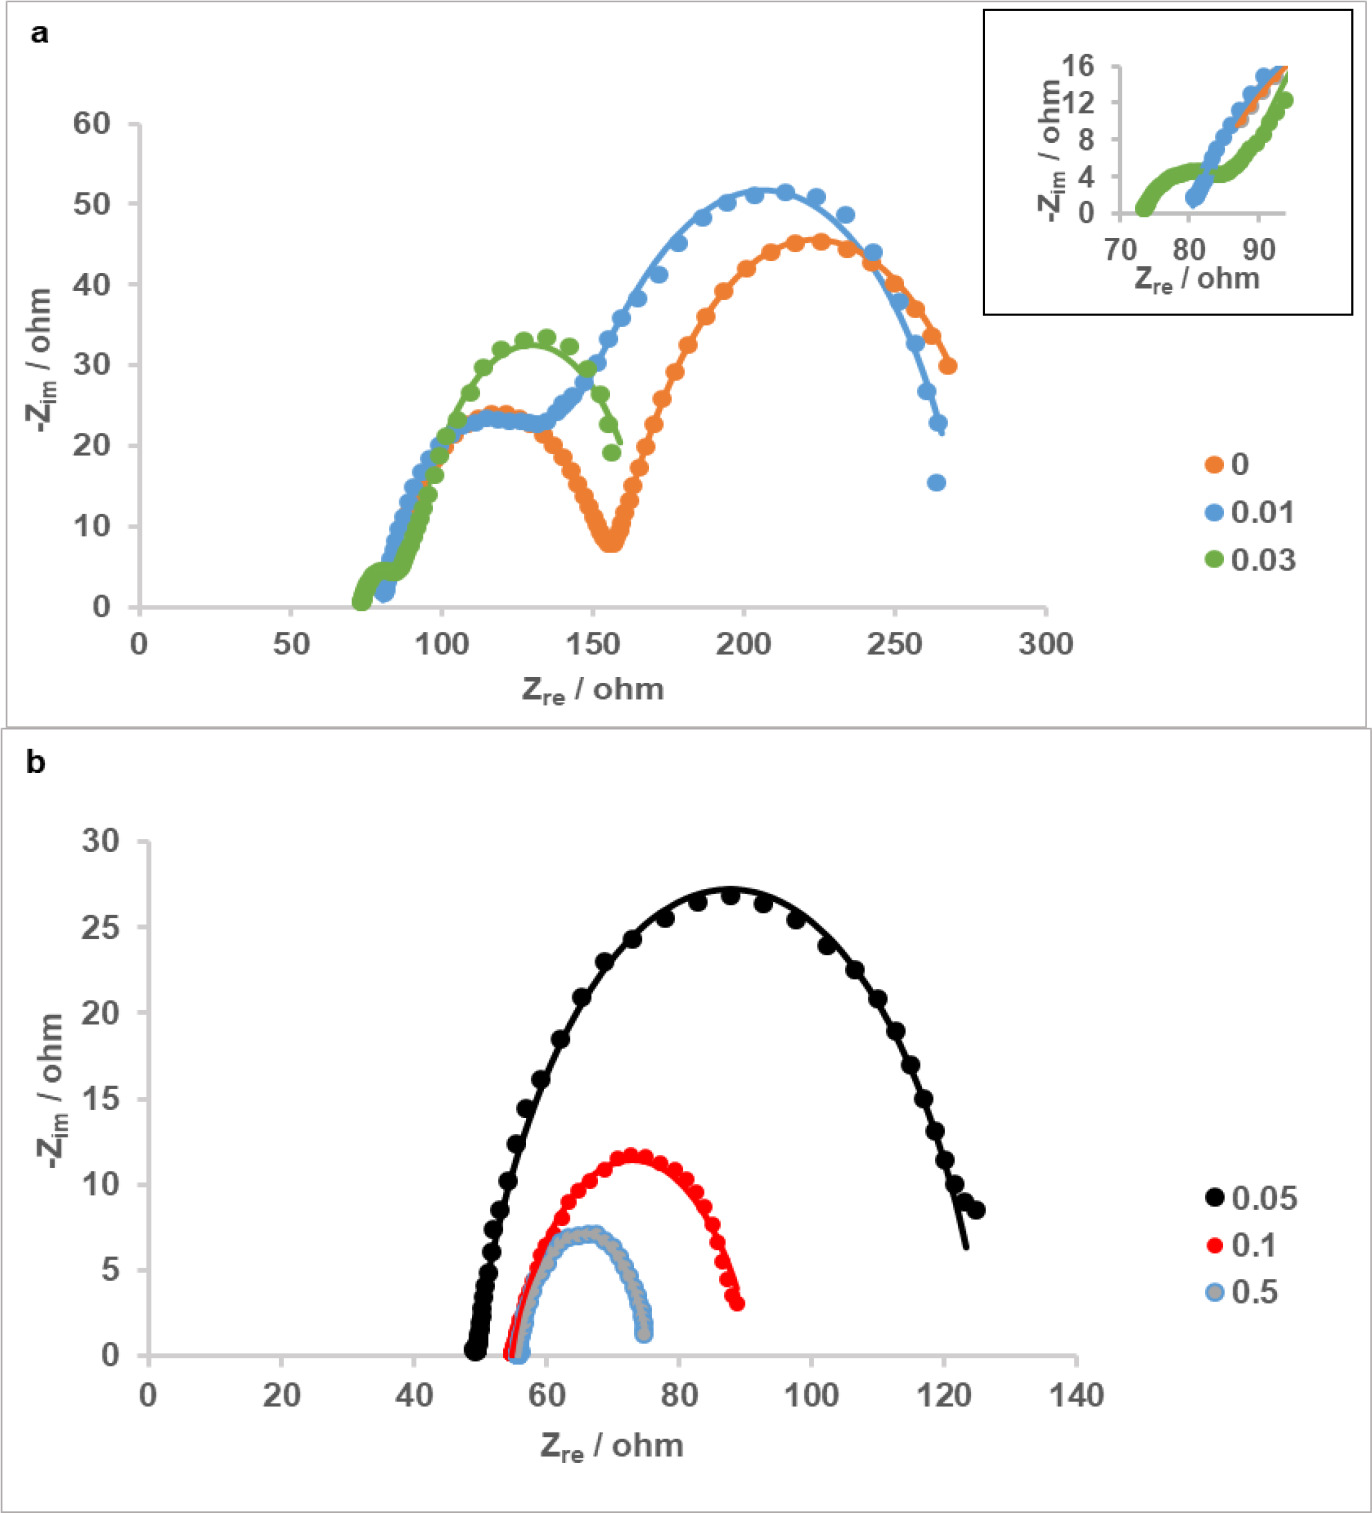
Figure 6. Potential dependence of impedance of the cathode with 0.1 mg Pt cm-2 loading.
Loading of the cathode with the lowest amount of Pt/C in this study (0.01 mg Pt cm-2) decreased the charge transfer resistance of the bare cathode by ∼ 13 Ω whereas diffusion resistances of these cathodes differed very little (Figure 5a, Table 1), suggesting that the presence of this minimal catalyst loading affected ORR kinetics but did not cause a significant change in the cathode structure which is related to diffusion process. When the catalyst loading was 0.03 mg Pt cm-2, the reduction of Rct and Rd with respect to bare cathode was more pronounced as these were decreased by 57.45 Ω and 54.74 Ω, respectively. Polarization resistance (Rp) for cathodes with 0.05, 0.1 and 0.5 mg Pt cm-2 were decreased with increasing catalyst loading and they were all smaller than the sum of Rct and Rd calculated for cathodes having less catalyst content.
Table 1: Values of electrical elements extracted by fitting EIS data of cathodes having different Pt loadings with equivalent circuits. . For 0.05, 0.1, and 0.5 mg Pt cm-2 cathodes, rows with and without (*) symbol show fitting results obtained by using equivalent circuit in Figure 1a and Figure 1b, respectively. For the other cathode samples, given parameters correspond to those obtained by using equivalent circuit in Figure 1a. χ2/|Z| values represent the goodness of the fit.
| Pt loading (mg cm-2) | RΩ (Ω) | Rct (Ω) | Q2 mF s(a2-1)) | a2 | Rd (Ω) | Q3 (mF s(a3-1)) | a3 | Rp (Ω) | Q4 (mF s(a4-1)) | a4 | χ2/|Z| |
|---|---|---|---|---|---|---|---|---|---|---|---|
| 0 | 80.52 | 76.13 | 0.14 | 0.712 | 133.8 | 34 | 0.76 | - | - | - | 3.48E-03 |
| 0.01 | 80.14 | 63.12 | 1.482 | 0.741 | 132.5 | 24 | 0.821 | - | - | - | 3.11E-03 |
| 0.03 | 72.39 | 18.68 | 6.673 | 0.539 | 79.06 | 80 | 0.867 | - | - | - | 2.79E-03 |
| 0.05 | 49.24 | - | - | - | - | - | - | 77 | 18 | 0.783 | 3.09E-03 |
| 0.1 | 54.85 | - | - | - | - | - | - | 36.39 | 43 | 0.715 | 8.76E-04 |
| 0.5 | 55.76 | - | - | - | - | - | - | 19.83 | 54 | 0.798 | 1.72E-04 |
| 0.05* | 49.47 | 15.98 | 42 | 0.942 | 61.71 | 28 | 0.770 | - | - | - | 1.29E-03 |
| 0.1* | 54.74 | 13.83 | 67 | 0.646 | 21.71 | 97 | 0.825 | - | - | - | 3.64E-04 |
| 0.5* | 55.8 | 6.846 | 69 | 0.855 | 12.39 | 125 | 0.9 | - | - | - | 3.84E-04 |
Despite the use of the same solution and cell configuration for all samples during EIS experiments, ohmic resistance measured between working and reference electrode differed for cathodes. RΩ, which was similar and between 80-80.5 Ω for the cathodes without catalyst loading and with 0.01 Pt cm-2; first decreased to 72.4 Ω with 0.03 mg Pt cm-2 and then to 49.5-55.8 Ω range with higher loadings (Table 1).
A more detailed examination of the apparent loops in Nyquist plots for cathodes with 0.05, 0.1 and 0.5 mg Pt cm-2 loadings (Figure 5b) revealed that the arcs constituting these loops were not perfectly symmetrical. This situation was especially evident in the cathode with 0.1 mg Pt cm-2 and brought out the possibility of the presence of two relatively close time constants corresponding to charge transfer and diffusion processes in Nyquist plots. With an attempt to mathematically solve these individual contributions to Rp of these cathodes, we first estimated the starting values for diameters of charge transfer and mass transfer semi-circles for the 0.1 mg Pt cm-2 cathode sample, based on characteristic frequencies of these two time constants and the x-axis intercepts to which high and low frequency arcs converged. By using the equivalent circuit in Figure 1a for the fitting process, we obtained the values for electrochemical components and used them as starting values to fit the spectra of the other cathodes with 0.05 and 0.5 mg Pt cm-2. Following this procedure, we were able to obtain the values for Rct, Rd and their corresponding CPE parameters; while the goodness of the fits with the newly used circuit was improved as compared to the previous one for 0.05 and 0.1 mg Pt cm-2 cathodes (Table 1). According to this fitting model, cathodes showed a decrease in both Rct and Rd between 3 samples with increasing loadings and these results were consistent with those of the other cathodes (0, 0.01 and 0.03 mg Pt cm-2), as the addition of more catalyst yielded an overall decrease in charge transfer and diffusion resistances.
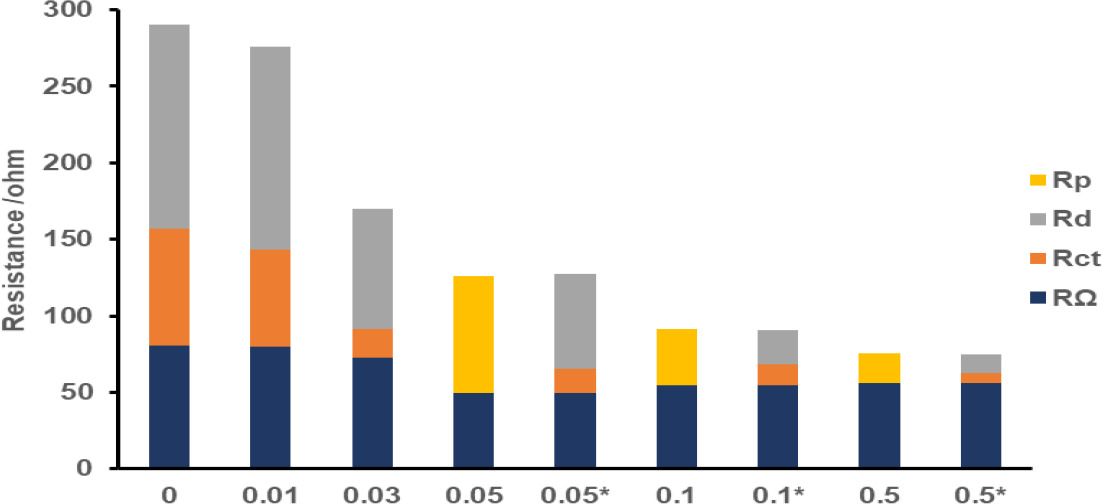
Distribution of resistive components of the individual cathodes is shown in Figure 7, in which fitting parameters obtained with both equivalent circuits for 0.05, 0.1 and 0.5 mg Pt cm-2 cathodes are given for clarity. For the cathodes with zero and 0.01 mg Pt cm-2 loadings, the major contributor to the internal resistance was diffusion resistance, which accounted for 46% and 48% of the total resistance, respectively. Loading with a minimal amount of catalyst decreased the charge transfer contribution of the negative control sample from 28% to only 23%, whereas ohmic and charge transfer percentages were close in both cathodes. With the 0.03 mg Pt cm-2 cathode, a dramatic decrease of the charge transfer contribution to 11% was found and from this loading on, the ratio of charge transfer resistance to internal resistance remained between 9-15%; which was the smallest among those of other components. While the 0.03 mg Pt cm-2 cathode had nearly equal contributions from ohmic and diffusion resistances, diffusion resistance percentages were reduced with increasing loadings from this point and eventually the internal resistance became ohmic-dominant for the cathodes with highest loadings (0.1 and 0.5 mg Pt cm-2). These findings indicated that 0.03 mg Pt cm-2 loading might be regarded as a turning point for which charge transfer resistances due to ORR kinetics contribute to the internal resistance to a much smaller extent than below this loading and this contribution changes relatively little for higher loadings. However, high diffusion resistance is still valid for 0.03 mg Pt cm-2 cathode and is the major cause for the difference between its resistance distribution profile and those of the cathodes with higher Pt loadings. For the cathodes whose impedance spectra were modelled by using the equivalent circuit in Figure 1b, the contribution of polarization resistance to internal resistance decreased from 61% to 40% and 26% as the Pt loading was increased.
Figure 7. Internal resistance of cathodes having 0-0.5 mg Pt cm-2 loadings in terms of ohmic resistance (RΩ), charge-transfer resistance (Rct), diffusion resistance (Rd) and polarization resistance (Rp). Symbol of (*) indicates cathode samples whose EIS data were analysed according to the equivalent circuit with 2 time constants in Figure 1a.
ORR is proposed to occur by a direct 4 electron transfer or an indirect 2 electron transfer mechanism per molecule of O2 consumed at the cathode. Corresponding redox potential of the half-cell reaction with 4e- transfer is 815 mV vs. SHE, whereas it ranges from 267 to 337 mV vs. SHE for 2e- transfer mechanism depending on the formation of H2O2, OH- or HO2- at pH 7 and 25 oC (Rossi et al., 2019). OCP of the cathode with the highest Pt loading in this study (0.5 mg cm-2) was 560 mV vs. SHE. Although this potential was still far from the thermodynamically predicted value for ORR through 4e-transfer, it was consistent with OCPs reported for in-house prepared and commercial gas diffusion cathodes with the same Pt loading (HaoYu et al., 2007). A non-negligible difference between theoretical and observed cathode potential at equilibrium is usually observed in MFCs (Logan and Regan, 2006), and explained by the formation of a mixed potential at the cathode due to substrate crossover from anode. These crossover effects are expected to be stronger in separator-free reactors like those in current study and Pt catalyst, in particular, has been shown to be susceptible to them earlier (Harnisch et al., 2009). The decrease in the cathode OCP with reduced Pt loadings was small down to a catalyst loading of 0.03 mg Pt cm-2 (a maximum difference of 29 mV between 0.5 and 0.03 mg Pt cm-2 cathode samples), but was significant when the loading was further reduced to 0.01 mg Pt cm-2 or zero, yielding 397 and 387 mV vs. SHE, respectively. These lower OCPs of the 0.01 mg Pt cm-2 and bare cathodes could be attributed to ORRs which are relatively incomplete and which proceed closer to the 2e- transfer mechanism compared to the higher Pt loading cathodes. Overall; OCPs of the cathodes became farther from the potential proposed for 4e- transfer ORR when the Pt loading was reduced, but loss in OCP was much more pronounced for the cathode having lowest Pt loading and cathode without catalyst.
As expected, maximum power densities obtained in MFCs were in the same order as the catalyst loading on cathodes. The addition of minimum amount of Pt only slightly improved the maximum power density of MFC with uncatalyzed cathode (59 ± 3 mW m-2 vs. 48 ± 1 mW m-2) and voltage outputs in the entire current density range, indicating that 0.01 mg cm-2 was not very effective as a minimal Pt loading with the coating method described here. The decrease in maximum power density of MFC was 38% or higher when the use of Pt loading was reduced from 0.5 to 0.1 mg cm-2 or lower loadings, suggesting a considerable effect of catalyst loading on this performance indicator. On the other hand, CE range obtained throughout the polarization experiments was almost unaffected when the loading was reduced from 0.5 to 0.05 mg cm-2 (∼15-33%), and lower (∼9-20%) when the loadings were between 0 and 0.03 mg cm-2. These low CEs usually result from decreased recovery of electrons from the substrate due to oxygen diffusion to the anode in MFC designs lacking a separator and the CE range obtained here with 0.5 mg cm-2 cathode was comparable to that obtained in a previous study which used the same cathode/reactor configuration and substrate, except lower current density range obtained here (Zhang et al., 2009). The durations of batch cycles in polarization experiments were unexpectedly longer with 0.1 and 0.05 mg Pt cm-2 cathodes than with 0.5 mg Pt cm-2 cathode, which resulted in higher CEs with these reduced loadings compared to 0.5 mg cm-2 at a given current density. In the work of Cheng et al., who showed CE data at 1 kΩ during an operational period of ∼25 cycles, CEs obtained with 0.1 mg cm-2 cathode were half of those obtained with 0.5 mg cm-2 cathode. CEs further decreased by 10-20% compared to 0.1 mg cm-2 in the absence of Pt (Cheng et al., 2006). By comparison, individual CE values obtained here at 1 kΩ were consistent with their findings for zero and 0.5 mg Pt cm-2 loadings, but CE obtained with 0.1 mg cm-2 cathode at 1 kΩ (∼17%) was higher than CE obtained with their cathode sample having the same loading. This difference is likely due to the trends observed in CEs with 0.05-0.5 mg Pt cm-2 loadings explained above.
For potentiostatic EIS experiments, a potential of -0.2 V vs. Ag/AgCl was chosen in order to observe diffusion resistances in cathodes along with resistances resulting from kinetic and ohmic limitations. Although impedance spectra of cathodes with 0.5, 0.1 and 0.05 mg Pt cm-2 at this selected cathode potential can be interpreted as the splitting of the main arcs into two, well-developed semi-circles corresponding to kinetic and diffusion processes were not clearly seen. In general, charge transfer resistance decreases with increasing overpotentials due to increasing kinetic rates, whereas resistance related to mass transfer effects is expected to appear below a certain potential and increase with further polarization for air-cathodes in PEM fuel cells (Yuan et al., 2007; Tang et al., 2006). Additional tests with these cathodes at higher potentials showed that there was not a diffusion-related characteristic at these potentials and single arcs present in spectra decreased in size with decreasing potential down to -0.2 V vs. Ag/AgCl, which means that apparent single loops observed at -0.2 V were either charge-transfer semi-circles that shrank with increasing overpotential, or a combination of a charge-transfer and a diffusion semi-circle which decreased and increased in size, respectively, compared to a spectrum that would be obtained at an intermediate potential between 2 lowest potentials examined. Therefore, spectra at -0.2 V for these samples were fitted in two ways, by using two equivalent circuits. For consistency, resistive element in the circuit with a single time-constant was proposed as polarization resistance rather than charge-transfer resistance, and polarization resistance included unknown portions of charge-transfer and diffusion resistance. On the other hand, spectra of cathodes having 0-0.03 mg Pt cm-2 loadings at -0.2 V showed 2 semi-circles clearly and modelled by using only the equivalent circuit with 2 time-constants.
Internal resistance of the cathodes increased with reduced loadings, as expected. Internal resistance of 0.01 mg cm-2 cathode mainly differed from the cathode without catalyst in charge-transfer portion, as shown by a ∼ 13 Ω decrease, indicating little kinetic improvement with this ultra low Pt loading. The dramatic decrease in charge-transfer resistance of 0.03 mg Pt cm-2 cathode with respect to 0.01 mg Pt cm-2 and relatively small decrease from this point on with higher loadings suggested that 0.03 mg cm-2 can be considered as the minimum Pt loading for which kinetic limitations are not of great concern and can be overcome to a large extent compared to lower loadings, although diffusion resistance of this cathode was still prominent. Like charge-transfer resistance, diffusion resistance was also found to decrease with increasing catalyst loadings. Diffusion layer structure, thickness of the catalyst layer and ionomer loading in cathodes are factors that possibly affect the transport of oxygen, protons or generated water at the cathode through the catalyst layer and therefore, diffusion resistance (Song et al., 2001; Lim et al., 2012). Considering the diffusion layers prepared in the same way for all cathodes in this study, differences in diffusion resistance can be attributed to catalyst layer thickness and Nafion content of cathodes which were varied with the application of different loadings by using the Pt/C catalyst with a constant weight percentage (20%) and constant weight ratio of ionomer to Pt/C (3:7). However, these effects can be better understood by using the same Pt loading but various thickness via altering Pt/C weight percentage, or by using the same Pt loading with various ionomer loadings in cathodes and their subsequent comparison in impedance spectra in terms of diffusion resistance.
An interesting finding throughout EIS experiments was the decrease of ohmic resistance to some extent with increasing catalyst loadings. In our setup, ohmic resistance includes contributions from resistance of the electrolyte solution, ionic and electronic resistances of the catalyst layer and contact resistances; while electronic and contact resistances are considered much smaller than ionic resistance [40] (Reimer et al., 2018). Therefore, the intercept values of the high frequency semicircles/arcs with the Zre axis in Figure 5a and 5b were mainly a combination of resistance of the electrolyte solution and ionic resistance of the catalyst layer. Assuming the same resistance for solution, it is likely that differences in RΩ were resulted from different ionic conductivities in the catalyst layers. Nafion ionomer, which was added to catalyst layers in proportion with Pt/C amounts in this study (constant weight ratio of ionomer to Pt/C = 3:7 in all samples), possibly enhanced proton transport there and decreased the RΩ with increasing catalyst loadings.
Conclusions
The effect of Pt loadings of cathodes in the 0-0.5 mg cm-2 range on MFC performance and impedance behaviour was evaluated. Reducing benchmarking Pt loading of 0.5 mg cm-2 by a factor of 5 or more resulted in a 38% or higher decrease in maximum power density. The lowest loading of 0.01 mg Pt cm-2 used in the study only slightly improved OCV, voltage output throughout polarization, maximum power density in MFC tests and charge-transfer resistance in EIS compared to the cathode without catalyst. Charge-transfer resistance of 0.03 mg cm-2 cathode was increased to a smaller extent than lower loadings when Pt loading was reduced, whereas OCPs of cathodes were comparable in the 0.03-0.5 mg Pt cm-2 range in contrast with its significant decrease with 0.01 mg Pt cm-2 and bare cathodes. Along with charge-transfer resistance, diffusion resistance was also found to increase with decreasing catalyst loadings on cathodes due to structural differences affecting mass transfer in catalyst layers.